Asset Tools
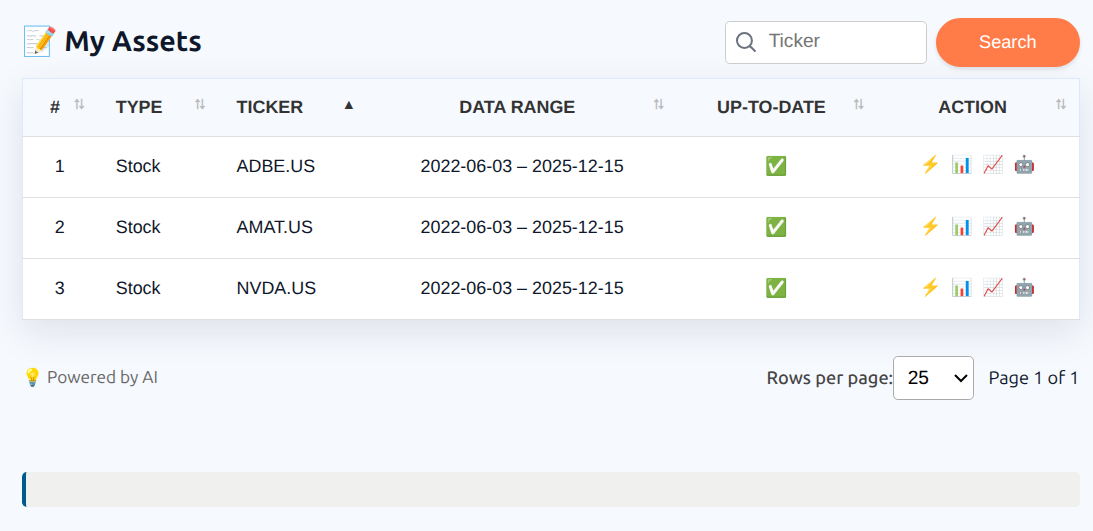
My Assets (https://app.investlens.ca/my_assets) collects every stock and ETF that appears anywhere in your account’s portfolios. From here you can open a single name and run analysis asset-by-asset: performance, technical levels, and a quick snapshot view.
Each row shows the data range available for the asset and whether its data is current, which is the quickest way to tell why an analytic might be waiting on data.
1. Search and coverage
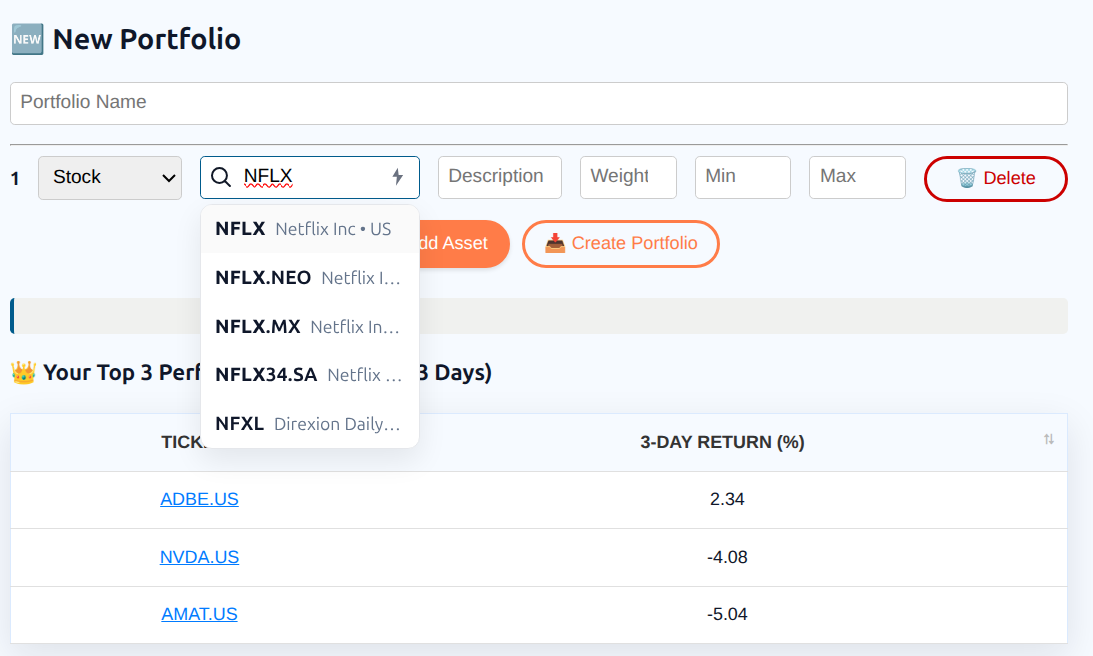
InvestLens includes a fast, search-first experience for finding tickers supported by our data vendor.
- Search by ticker or name
- Add the asset to a new portfolio by one click
- Coverage depends on what is available from the upstream vendor
2. Asset Snapshot
The Snapshot drawer is a quick-look panel designed for fast context without leaving your workflow.
It typically includes:
- Analyst consensus rating and how many analysts contributed, with the distribution of recommendations (Buy / Hold / Sell)
- Beta indicator
- 52-week price range with markers (Price, Target if available, 50D/200D moving averages)
- News Sentiment (when available)
- Basic valuation and earnings-surprise context over the past year (when available)
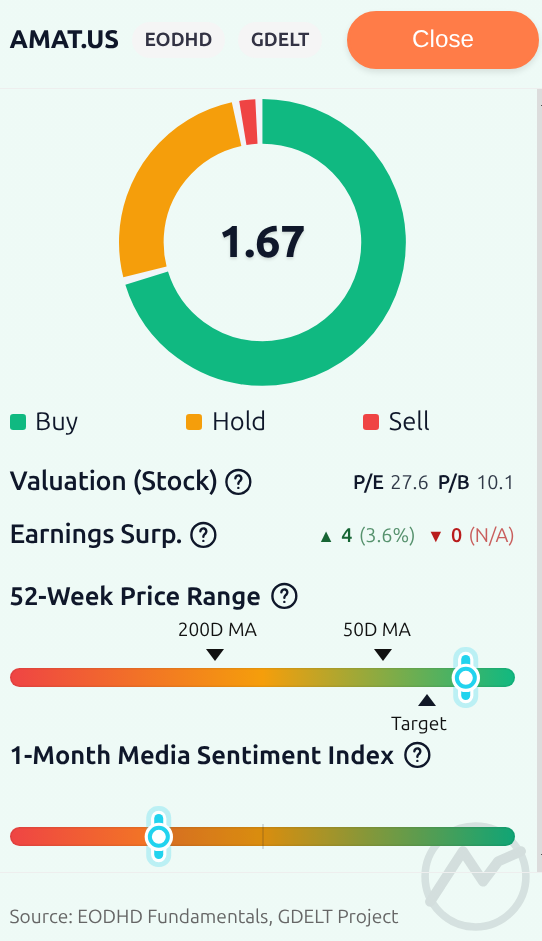
Snapshot is meant for triage and orientation. It is not meant to replace deeper research.
Iris can also place the same snapshot into a conversation as a compact card, up to three at a time, so a few tickers can be compared side by side.
2.1 News Sentiment
The News Sentiment reading is the average sentiment of the latest day of news headlines for the asset, on a scale from −1 (bearish) through 0 (neutral) to +1 (bullish). It is drawn on the same red → amber → green bar as the 52-week range, with a tick at neutral. Underneath, a caption gives the score, the mood label, how many headlines it came from, and the news day it is as of.
- It is the same measure, on the same scale, as the Market Mood strip shown above every signed-in page, computed by the same pipeline — so the number on a snapshot agrees with the one on your dashboard rather than being a second, unrelated figure.
- When there is no reading for a ticker — no headlines that day, or the lookup failed — the section says News Sentiment Unavailable and the rest of the card is unaffected.
3. Technical levels and trading signal
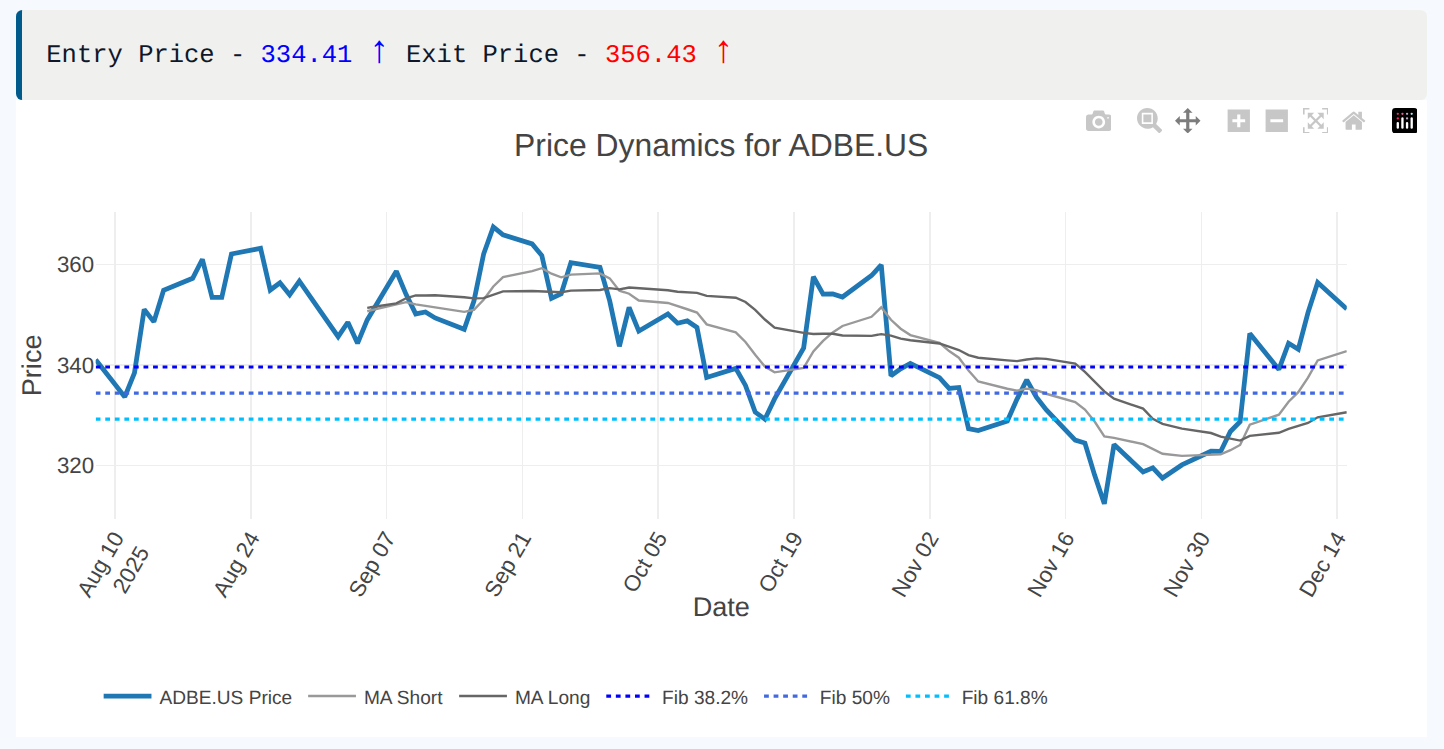
InvestLens can compute simple, interpretable technical levels to help frame entry/exit zones.
The levels chart shows:
- Fibonacci retracement levels (commonly 38.2%, 50%, 61.8%), derived from a recent swing high/low range, along with candidate buy/sell prices
- Moving averages (short-term EMA and long-term SMA), using the lengths and lookback set in Asset settings
Recent swing highs and lows are used internally to determine the Fibonacci swing range; they are not drawn as separate support/resistance lines.
3.1 What the Fibonacci signal does
The Fibonacci tool identifies a recent swing range (a recent high-to-low or low-to-high move), then derives retracement levels within that range.
- In an uptrend, it highlights potential pullback levels (possible buy zones) and uses the recent high as a reference sell/exit level.
- In a downtrend, it highlights potential bounce levels (possible sell zones) and uses the recent low as a reference buy/cover level.
InvestLens presents:
- Candidate buy price
- Candidate sell price
- The retracement levels used to generate those candidates
This is a heuristic signal for planning, not a guarantee that price will behave this way.
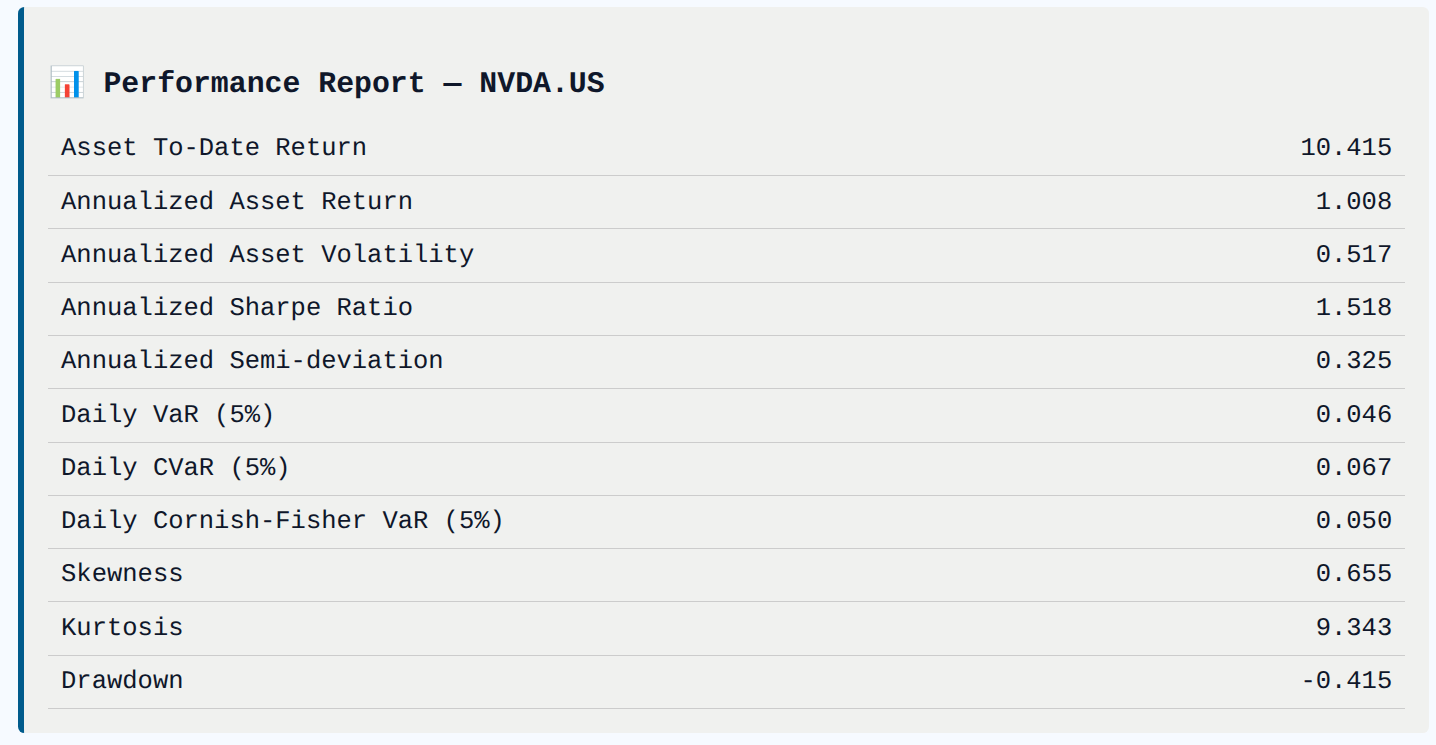
4. Asset Performance Report
The Asset Performance Report mirrors the Portfolio Performance Report , but for a single asset.
4.1 Compare up to three assets side by side
The asset report supports the same side-by-side comparison as the portfolio report: a + control on the last column header adds another of your held assets as an extra column, up to three columns in total, and × removes an added column.
- The picker searches your own assets only — a portfolio cannot be added to an asset report.
- Each addition offers the combined multi-column report as a JSON download.
5. Notes and limitations
- Technical levels are descriptive tools, not promises.
- Results depend on the selected lookback window and available data history.
- Snapshot fields may be missing depending on the asset and vendor coverage.