Portfolio Tools
Portfolios turn an Idea into a weighted set of holdings you can analyze, backtest, and refine. Most portfolios start from an Idea (a saved shortlist), then get weights either manually or via the Asset Allocator.
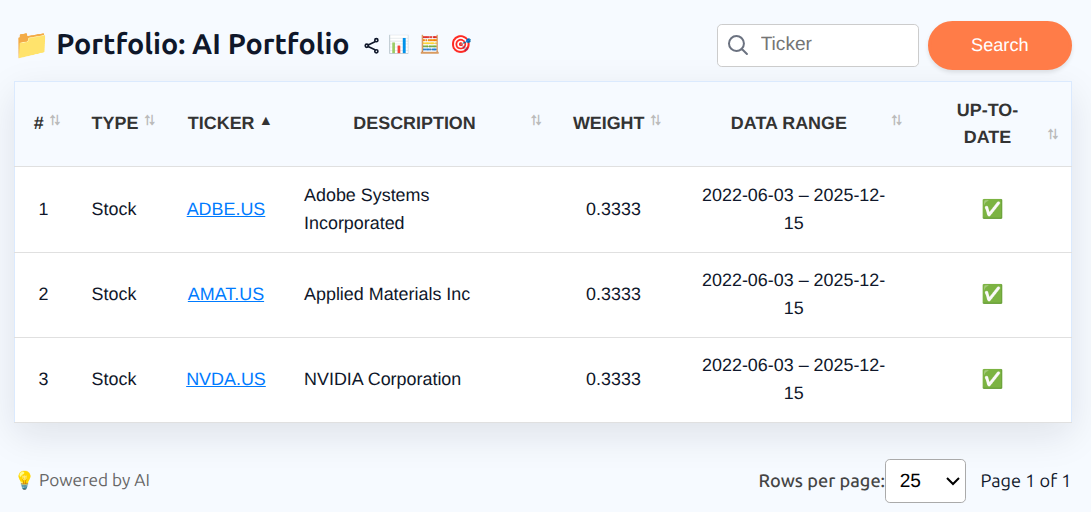
My Portfolios (https://app.investlens.ca/my_portfolios) is the hub: search and sort your portfolios, open one, edit or delete it, launch any of the analytics below, or share it. Opening a portfolio gives you View Portfolio, which lists every holding with its type, ticker, description, weight, and market-data status, and offers the same analytics while you look at the holdings.
1. Create a Portfolio
Portfolios are built on the New Portfolio page (https://app.investlens.ca/new_portfolio), which is also the edit screen for an existing portfolio. While you build, the page can show the strongest and weakest performing holdings over a recent period.
1.1 From an Idea
- Open My Ideas
- Select an Idea
- Click New Portfolio
- Name the portfolio and confirm
The assets carry over pre-filled, so you can review and save.
A portfolio inherits the Idea’s holdings as the starting universe, but becomes its own object with its own weights, constraints, and analytics.
1.2 From scratch
Give the portfolio a name and add assets, searching by ticker as you go.
1.3 From a CSV file
You can build a portfolio from a spreadsheet export. The file is parsed in your browser — it is never uploaded or stored.
Expected columns, in order:
| Column | Required | Notes |
|---|---|---|
| Type | Yes | e.g. ETF, Stock, Bond, Bond Fund, or Index |
| Ticker | Yes | |
| Description | Yes | |
| Weight | No | Optional; if present, a number between 0 and 1 |
| Min weight | No | Optional; 0–1 and ≤ Weight |
| Max weight | No | Optional; 0–1 and ≥ Weight |
- The delimiter is detected automatically — comma, semicolon, tab, or pipe.
- Common spreadsheet export quirks are handled: byte-order marks, and Windows, Unix, or old-Mac line endings.
- A header row is detected and skipped automatically.
- Any weight columns present are validated (each between 0 and 1, with min ≤ weight ≤ max); an out-of-range or inconsistent value rejects the file.
- The portfolio name defaults to the file name (without its extension) if you leave it blank.
2. Holdings and weights
A portfolio is a list of assets plus weights (allocations). When a portfolio is first created, weights may be empty or unset.
You can set weights in two ways:
- Manual weights: type in your own allocations (subject to min/max constraints).
- Asset Allocator weights: let InvestLens propose weights based on your selected settings.
3. Asset Allocator and backtesting
The Asset Allocator proposes several standard allocations and backtests them over a chosen historical window so you can compare tradeoffs. You can set the period used for backtesting in Portfolio settings.
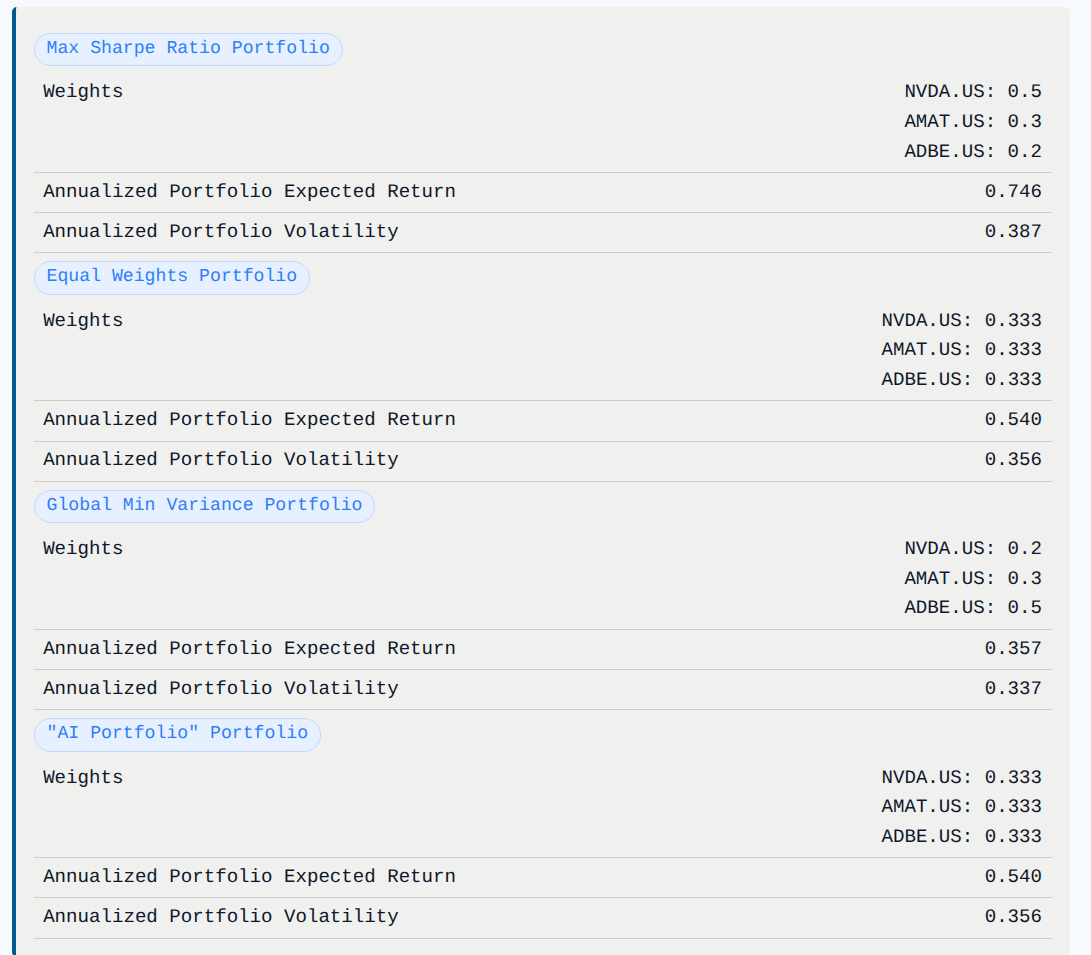
Typical allocations include:
- Max Sharpe (MSR): targets the highest Sharpe ratio given an input risk-free rate.
- Equal Weight (EW): allocates evenly across holdings.
- Global Minimum Variance (GMV): targets lower volatility given the estimated covariance.
- Custom: respects your current weights and constraints (and may be used as a baseline).
3.1 Constraints
You can optionally set per-asset constraints such as:
- Minimum weight (
w_min) - Maximum weight (
w_max)
in portfolio creation or edit screens.
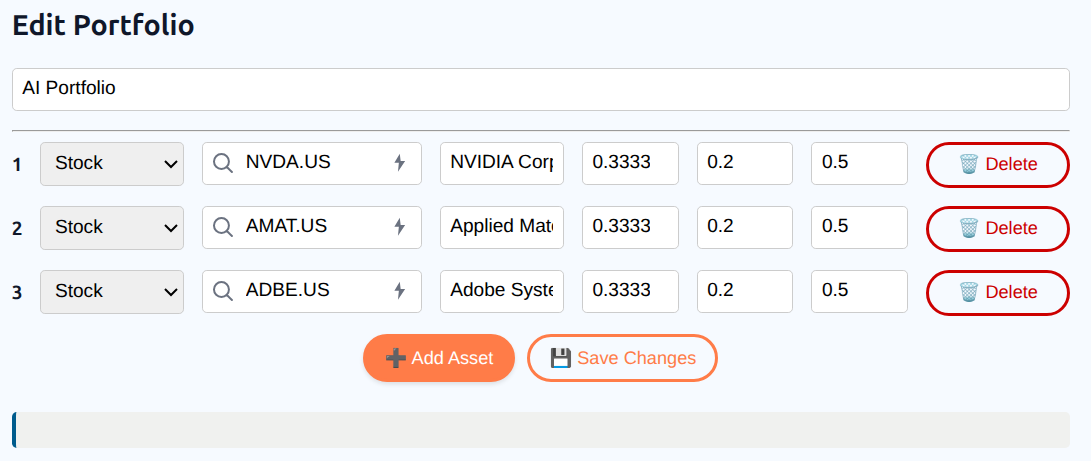
These constraints are used when generating allocator outputs.
3.2 Backtest output
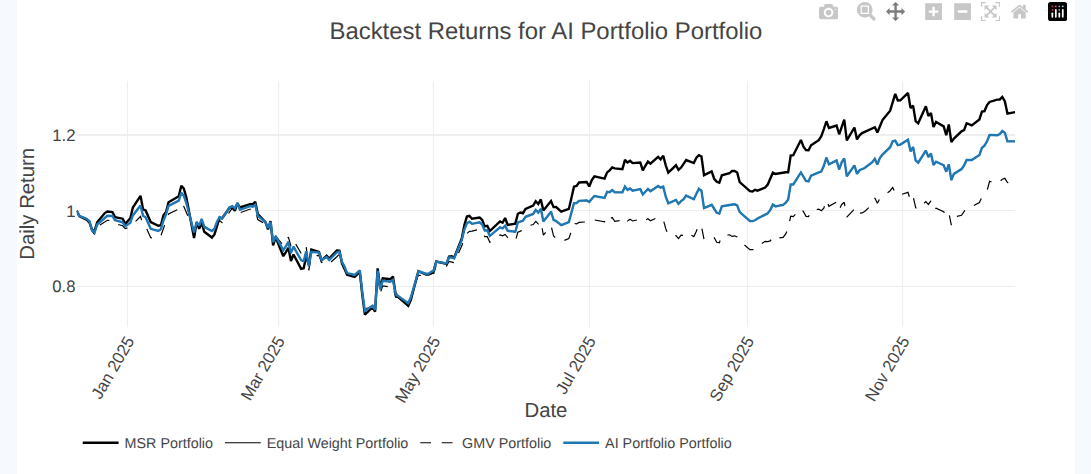
For each allocation, InvestLens can show a historical growth-of-$1 series (or equivalent cumulative return series) over your chosen backtest window.
This helps answer questions like:
- “Does the max-Sharpe portfolio outperform, or does it just look good on paper?”
- “Is the low-variance portfolio actually more stable during drawdowns?”
- “How different is my custom portfolio from the suggested allocations?”
3.3 What the Allocator reports
For each of the four variants — your custom weights, Max Sharpe, Equal Weight, and Min Variance — the Allocator returns a cumulative return series, a drawdown series, and summary metrics: total return, annualized return, annualized volatility, Sharpe ratio, annualized semi-deviation, maximum drawdown, VaR (95%), CVaR (95%), skewness, and kurtosis. It also reports the exact backtest date range and the number of trading days used, so you can see what window the comparison rests on.
3.4 Comparison view
Alongside the results you pick which optimised allocation to measure against — Max Sharpe, Equal Weight, or Min Variance — and switch between three charts: growth over time, drawdowns, and yearly returns. Every chart, including yearly returns, plots your own weights against the chosen optimised allocation, so you can see which years the optimised mix would have helped or hurt rather than only the overall totals.
3.5 When expected returns come from the factor model
If your expected return method is set to multi-factor (Fama-French), a holding whose factor fit is unreliable is kept in the optimization but has its expected return estimated from its own historical average instead. These fallback holdings are reported separately from excluded holdings, so it is clear they were still included, just estimated a different way. See Data quality and exclusions.
4. Portfolio Backtester
The Backtester tests how a portfolio would have performed historically over a period you choose. Open it from a portfolio's actions on My Portfolios or View Portfolio.
You can:
- Choose a start date and end date.
- Run the backtest and compare the portfolio against a selected benchmark.
- Review headline performance and risk results.
- View charts for growth over time, drawdowns, and yearly returns.
- Review a risk breakdown.
Reported results may include total return, annualized return, maximum drawdown, Sharpe ratio, volatility, excess return versus the benchmark, downside risk measures, value-at-risk, and measures of the shape and extremity of returns.
5. Performance Report
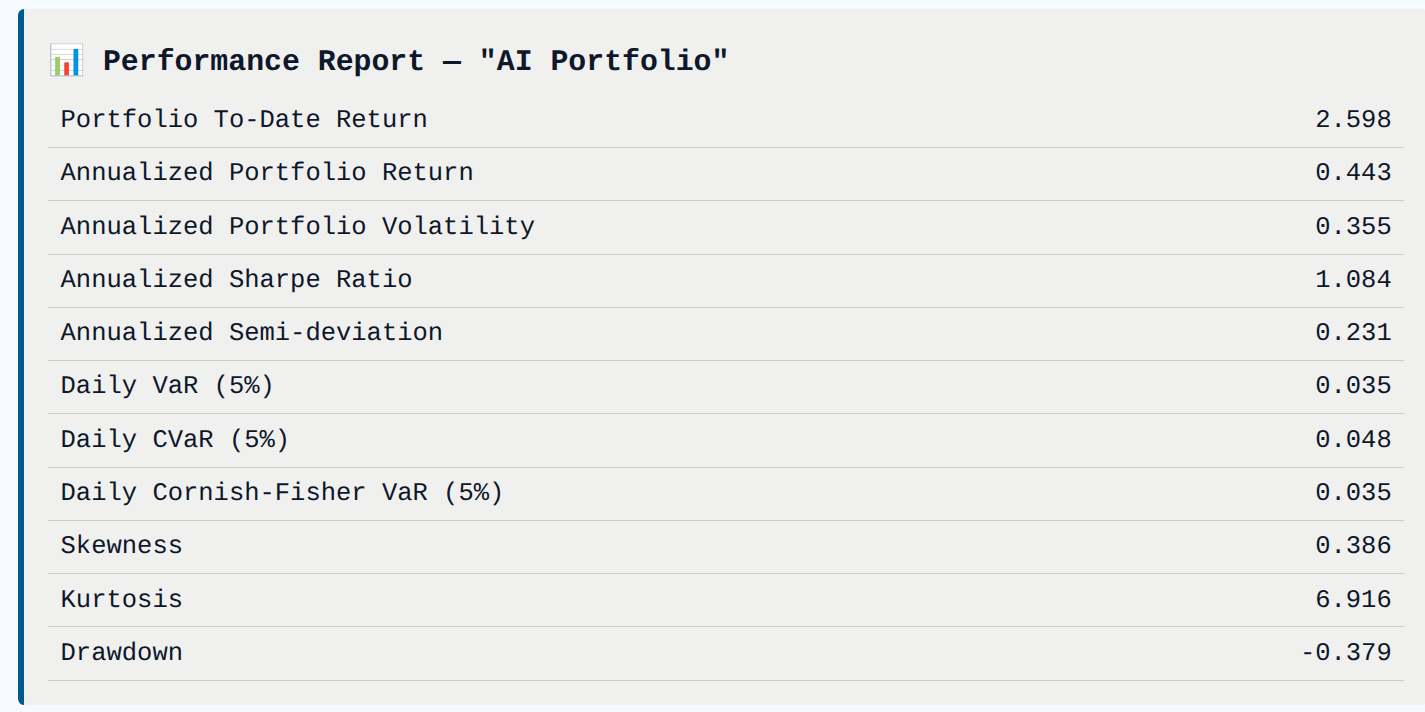
The Performance Report is a statistical summary of portfolio behavior over the selected time window.
5.1 What the Performance Report measures
Below are the most common fields you may see:
| Metric | What it means |
|---|---|
| Portfolio To-Date Return | Cumulative return over the period of Data Collection (see Portfolio details), based on the portfolio’s weighted daily returns. |
| Annualized Portfolio Return | The portfolio’s return scaled to an annual rate (assumes 252 trading days per year). |
| Annualized Portfolio Volatility | Standard deviation of daily portfolio returns scaled to an annual volatility. Higher means more variability. |
| Annualized Sharpe Ratio | Risk-adjusted return: (annualized return − risk-free rate) ÷ annualized volatility. Higher is better (all else equal). |
| Annualized Semi-deviation | Volatility of negative returns only (downside risk), scaled to annual. Useful when you care more about losses than swings. |
| Daily VaR (5%) | Value at Risk at the selected confidence level (commonly 5%): a threshold such that roughly 5% of daily returns are worse than this number (historical method). |
| Daily CVaR (5%) | Conditional VaR (Expected Shortfall): average loss given returns are beyond the VaR threshold. More conservative than VaR. |
| Daily Cornish-Fisher VaR (5%) | A parametric (normal-approximation) VaR estimate. |
| Skewness | Asymmetry of returns. Negative skew means larger downside tail risk; positive skew means larger upside tail. |
| Kurtosis | Tail heaviness vs normal distribution. Higher kurtosis usually implies more extreme outcomes. |
| Drawdown | Worst peak-to-trough decline in the period (the lowest drawdown value). Useful for “how bad did it get?” |
Where applicable, metrics are computed over the full return history available in the InvestLens database for the assets in the selected portfolio, as of the report’s as-of date. The effective date range is constrained by data availability (for example, if the database has 3 years of history, the report uses 3 years; if an asset has only 1 year of history, the usable window may be 1 year). The exact date range used for the portfolio can be verified in the portfolio Details view.
5.2 Compare up to three portfolios side by side
The report opens as a single column. A + control on the last column header adds another of your portfolios as an extra column, up to three columns in total, with every metric lined up row by row. Added columns can be removed again with ×; the original column stays.
- The picker searches your own portfolios only — an asset cannot be added to a portfolio report.
- Each addition offers the combined multi-column report as a JSON download.
- Comparison columns are available on My Portfolios. Opening the report from View Portfolio gives you the single-column version.
6. Portfolio analytics report
A richer written analytics report, useful when you want a narrative review rather than only numbers.
- Request it from a portfolio's actions, or ask Iris for it.
- It runs in the background, and can be opened or downloaded once ready.
- A finished report stays downloadable for one hour. In Workspace, the Reports dropdown in the command bar collects finished reports for that hour so you can reopen one without regenerating it. In Legacy, the only link is the one in the status message where you requested it — navigate away and you lose the link, even though the report itself is still valid for the rest of the hour.
- The report covers the same asset set the Allocator would use, so holdings with unusable price history are left out rather than skewing it. If no holding has usable history the report is not started at all — see Data quality and exclusions.
7. Style Analysis
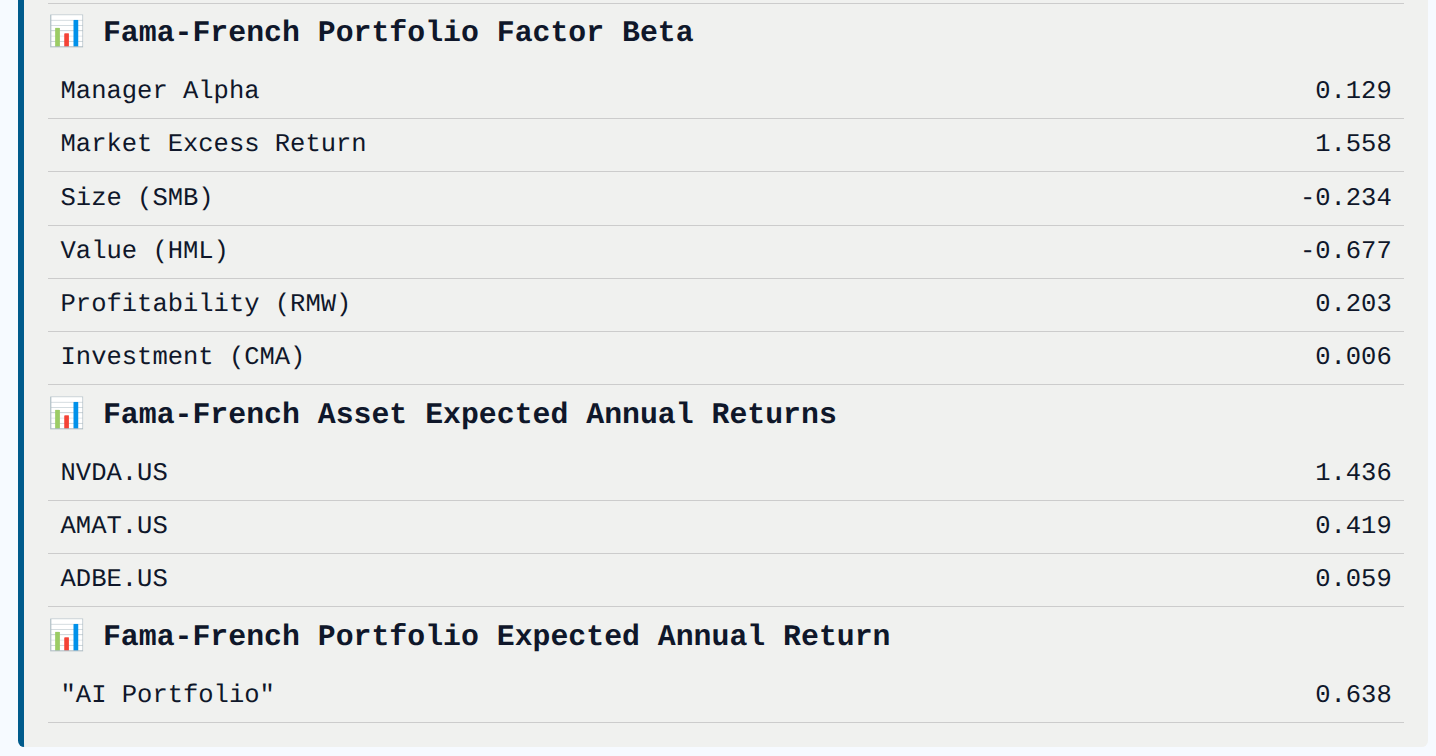
Style Analysis explains what kind of risk and return drivers your portfolio behaves like, using a standard multi-factor model.
InvestLens supports a factor-based style view referencing the Fama-French 5 Factor model (2×3) data library: Fama/French 5 Factors (2x3)
7.1 The five factors
| Factor | Common label | Intuition |
|---|---|---|
| Market | Mkt − Risk Free | Broad equity market exposure. Positive exposure implies you tend to move with the market; negative implies you tend to move against it. |
| Size | SMB | Small-cap vs large-cap tilt. Positive exposure implies a small-cap tilt; negative implies a large-cap tilt. |
| Value | HML | Value vs growth tilt. Positive exposure implies a value tilt; negative implies a growth tilt. |
| Profitability | RMW | Robust vs weak profitability tilt. Positive exposure implies a tilt toward more profitable firms; negative implies weaker profitability exposure. |
| Investment | CMA | Conservative vs aggressive investment tilt. Positive exposure implies a tilt toward firms that invest more conservatively; negative implies more aggressive investment exposure. |
7.2 What you get from style analysis
Style analysis typically reports:
- Factor exposures (betas): how sensitive the portfolio is to each factor.
- Alpha (if shown): return not explained by the factors over the period (a model residual).
- Interpretation: summarizes Fama–French factor tilts such as size (SMB), value (HML), profitability (RMW), and investment/asset-growth behavior (CMA), along with the portfolio’s overall sensitivity to broad equity movements (market beta).
An optional measure of skill beyond the standard factors (alpha) can be turned on in Portfolio settings.
8. Data quality and exclusions
Every portfolio analytic that needs price history — the Asset Allocator, the Performance Report, the portfolio analytics report, style analysis, and the same analyses run by Iris — applies one consistent rule.
8.1 Holdings without usable history are left out
A holding is excluded when its price history is missing or unusable, and the reason is always reported specifically rather than as a generic "no data":
| Reason | What it means |
|---|---|
| No price history yet | Market data is fetched in the background, so a just-created portfolio or a newly added ticker may not have data yet. Try again shortly. |
| Did not pass anomaly detection | The vendor series failed our data checks — for example a bad split or a feed glitch. |
| No price variation over the period | The series is flat over the window, so risk and return cannot be estimated from it. |
The distinction matters: it tells a still-downloading asset apart from one with a genuine data problem.
8.2 Remaining weights are rescaled to 100%
When holdings are excluded, the weights of the remaining holdings are rescaled to total 100%. Results — including the "custom" allocation the optimised mixes are compared against — are therefore measured on a fully-invested basis over the holdings that do have usable history, rather than treating the excluded slice as idle cash and understating return and risk.
8.3 When nothing is usable
If no holding in the portfolio has usable price history, no result is produced at all: no summary, no factor exposures, and the written report is not started. You are told the market data may still be downloading — common for a just-created portfolio — and to try again shortly. On the style analysis page excluded holdings simply do not appear in the factor tables; asking Iris to run it names each holding that was left out and why.
9. Notes and limitations
- Portfolios and reports are decision-support tools for research and workflow, not execution instructions.
- Allocations are sensitive to assumptions (return estimates, covariance estimates, constraints, and lookback window).
- Backtests are historical and do not guarantee future results.
- Factor/style analysis depends on data availability and may vary across time windows.